Your iOS app. Your Windows workspace.
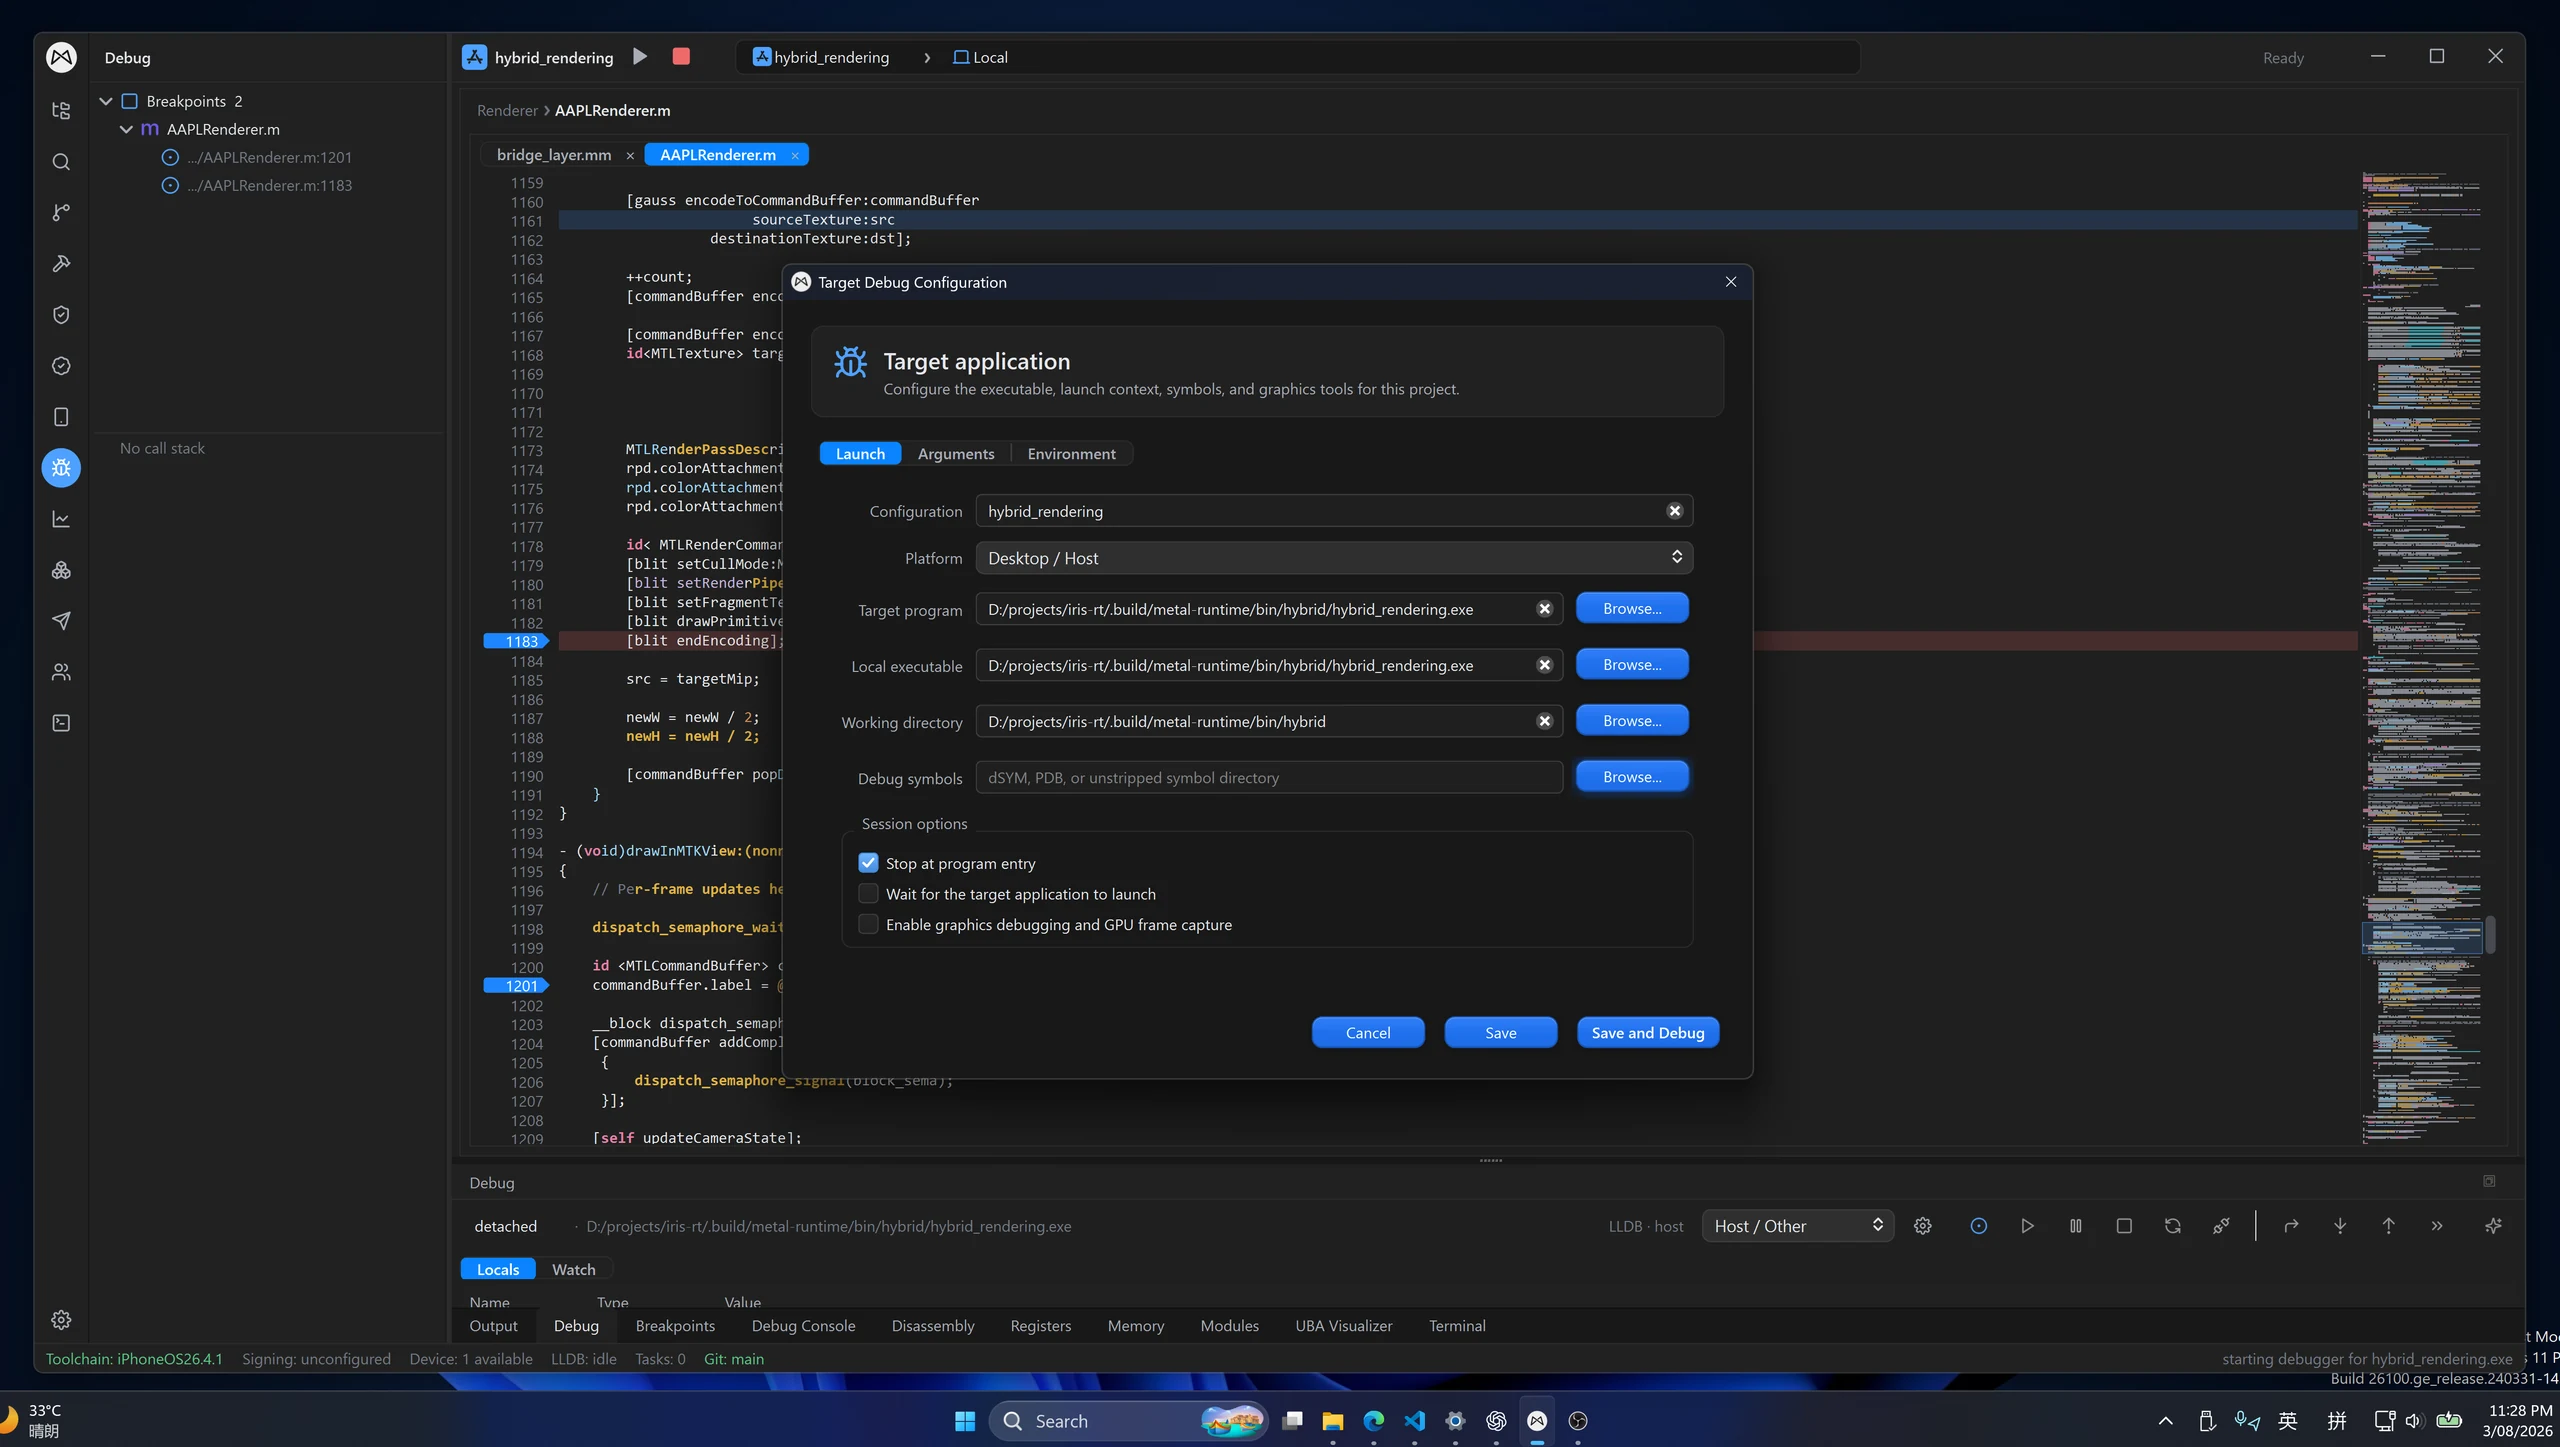
Use LLDB in Ycode to debug supported native iOS and Unity IL2CPP apps from Windows, with real devices, matching symbols and source context. This guide focuses on iOS; Ycode also lets you debug iOS, Android and Windows apps simultaneously.
- LLDB-backed debugging
- Physical iOS devices
- Unity IL2CPP workflows
A shorter path to your next iteration.
Prepare the app
Use a development-signed, debuggable build with source and matching native symbols.
Connect the device
Trust the Windows host, enable the required device development settings and select your target.
Launch and inspect
Configure the launch or attach target, set breakpoints, and inspect threads and variables.
Make the target explicit.
Choose the iOS app, device and debug configuration in Ycode. Keep build output and signing settings consistent with the binary you are about to run, and load symbols that match that build.
- Development-signed app and matching debug symbols
- Target and symbol configuration in the debugger
- Required SDK, device support and pairing in place
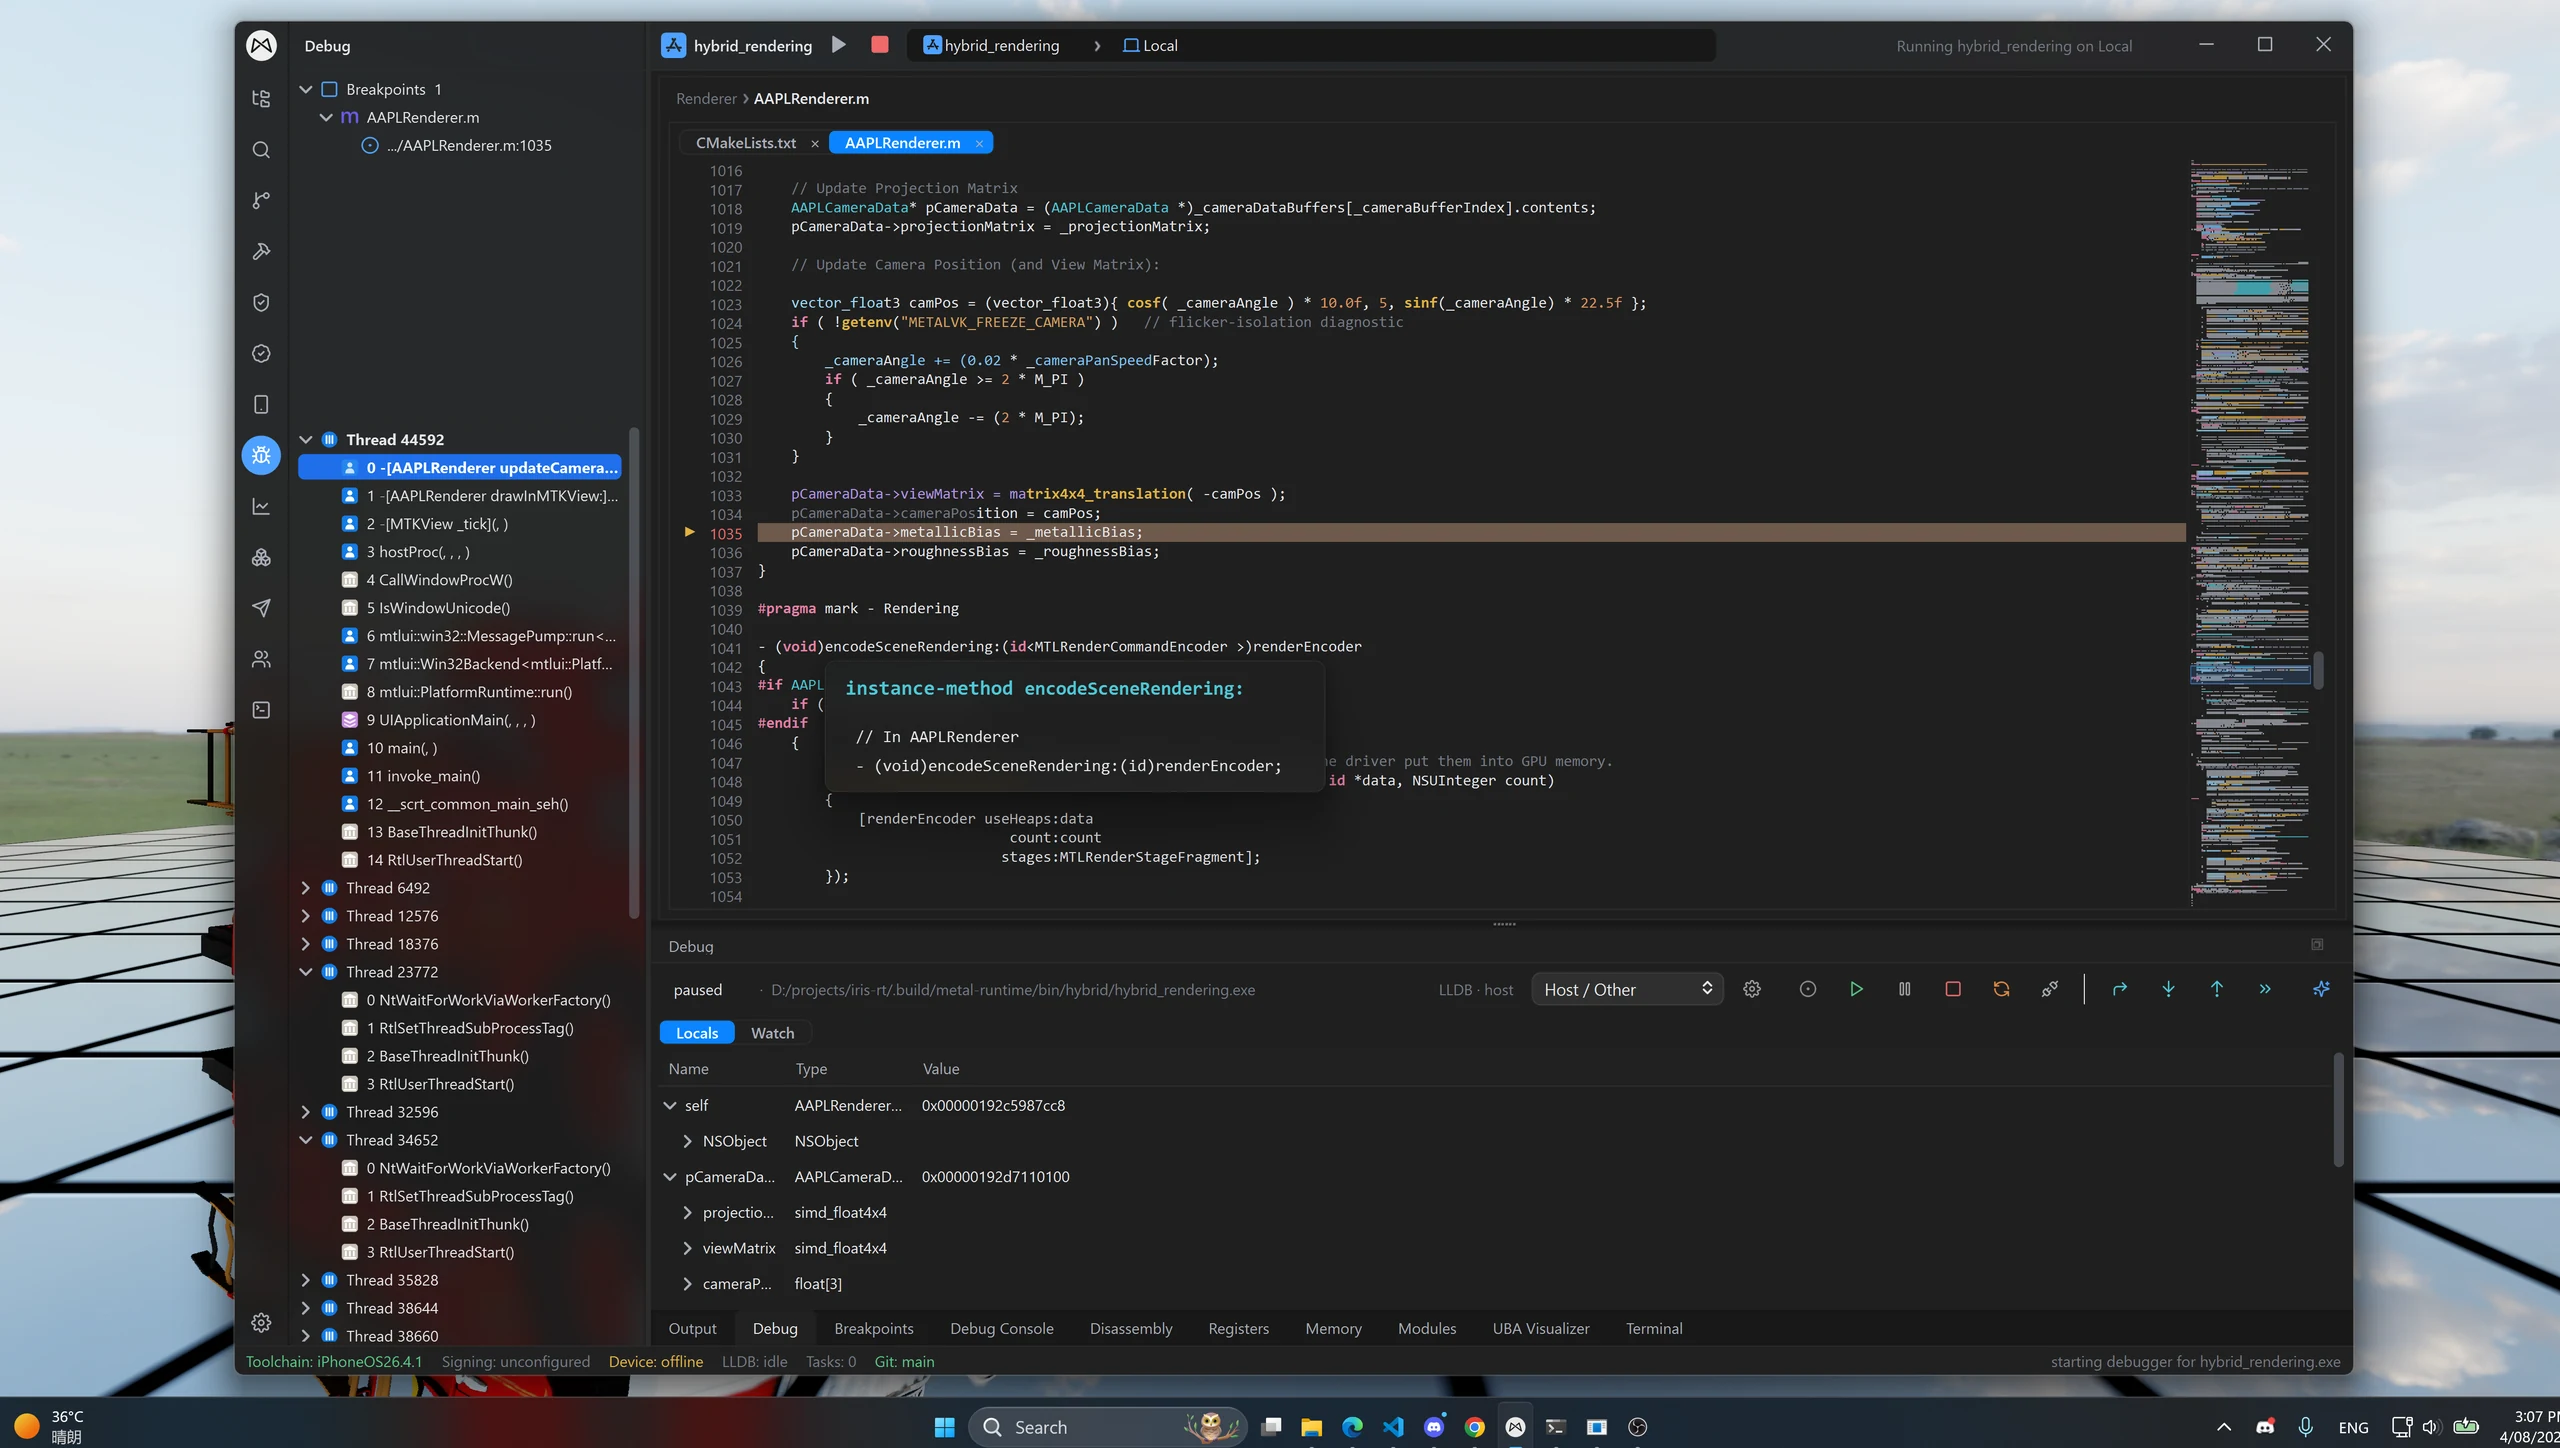
Stop in native code. Stay in context.
Inspect the running app with LLDB-backed debugging from your Windows workstation. The Unity demo shows an iOS IL2CPP workflow, where native debugging follows the generated C++ and its symbols.
- Threads, call stacks, locals and watches
- Native iOS and Unity IL2CPP inspection
- Source context and inline symbol information
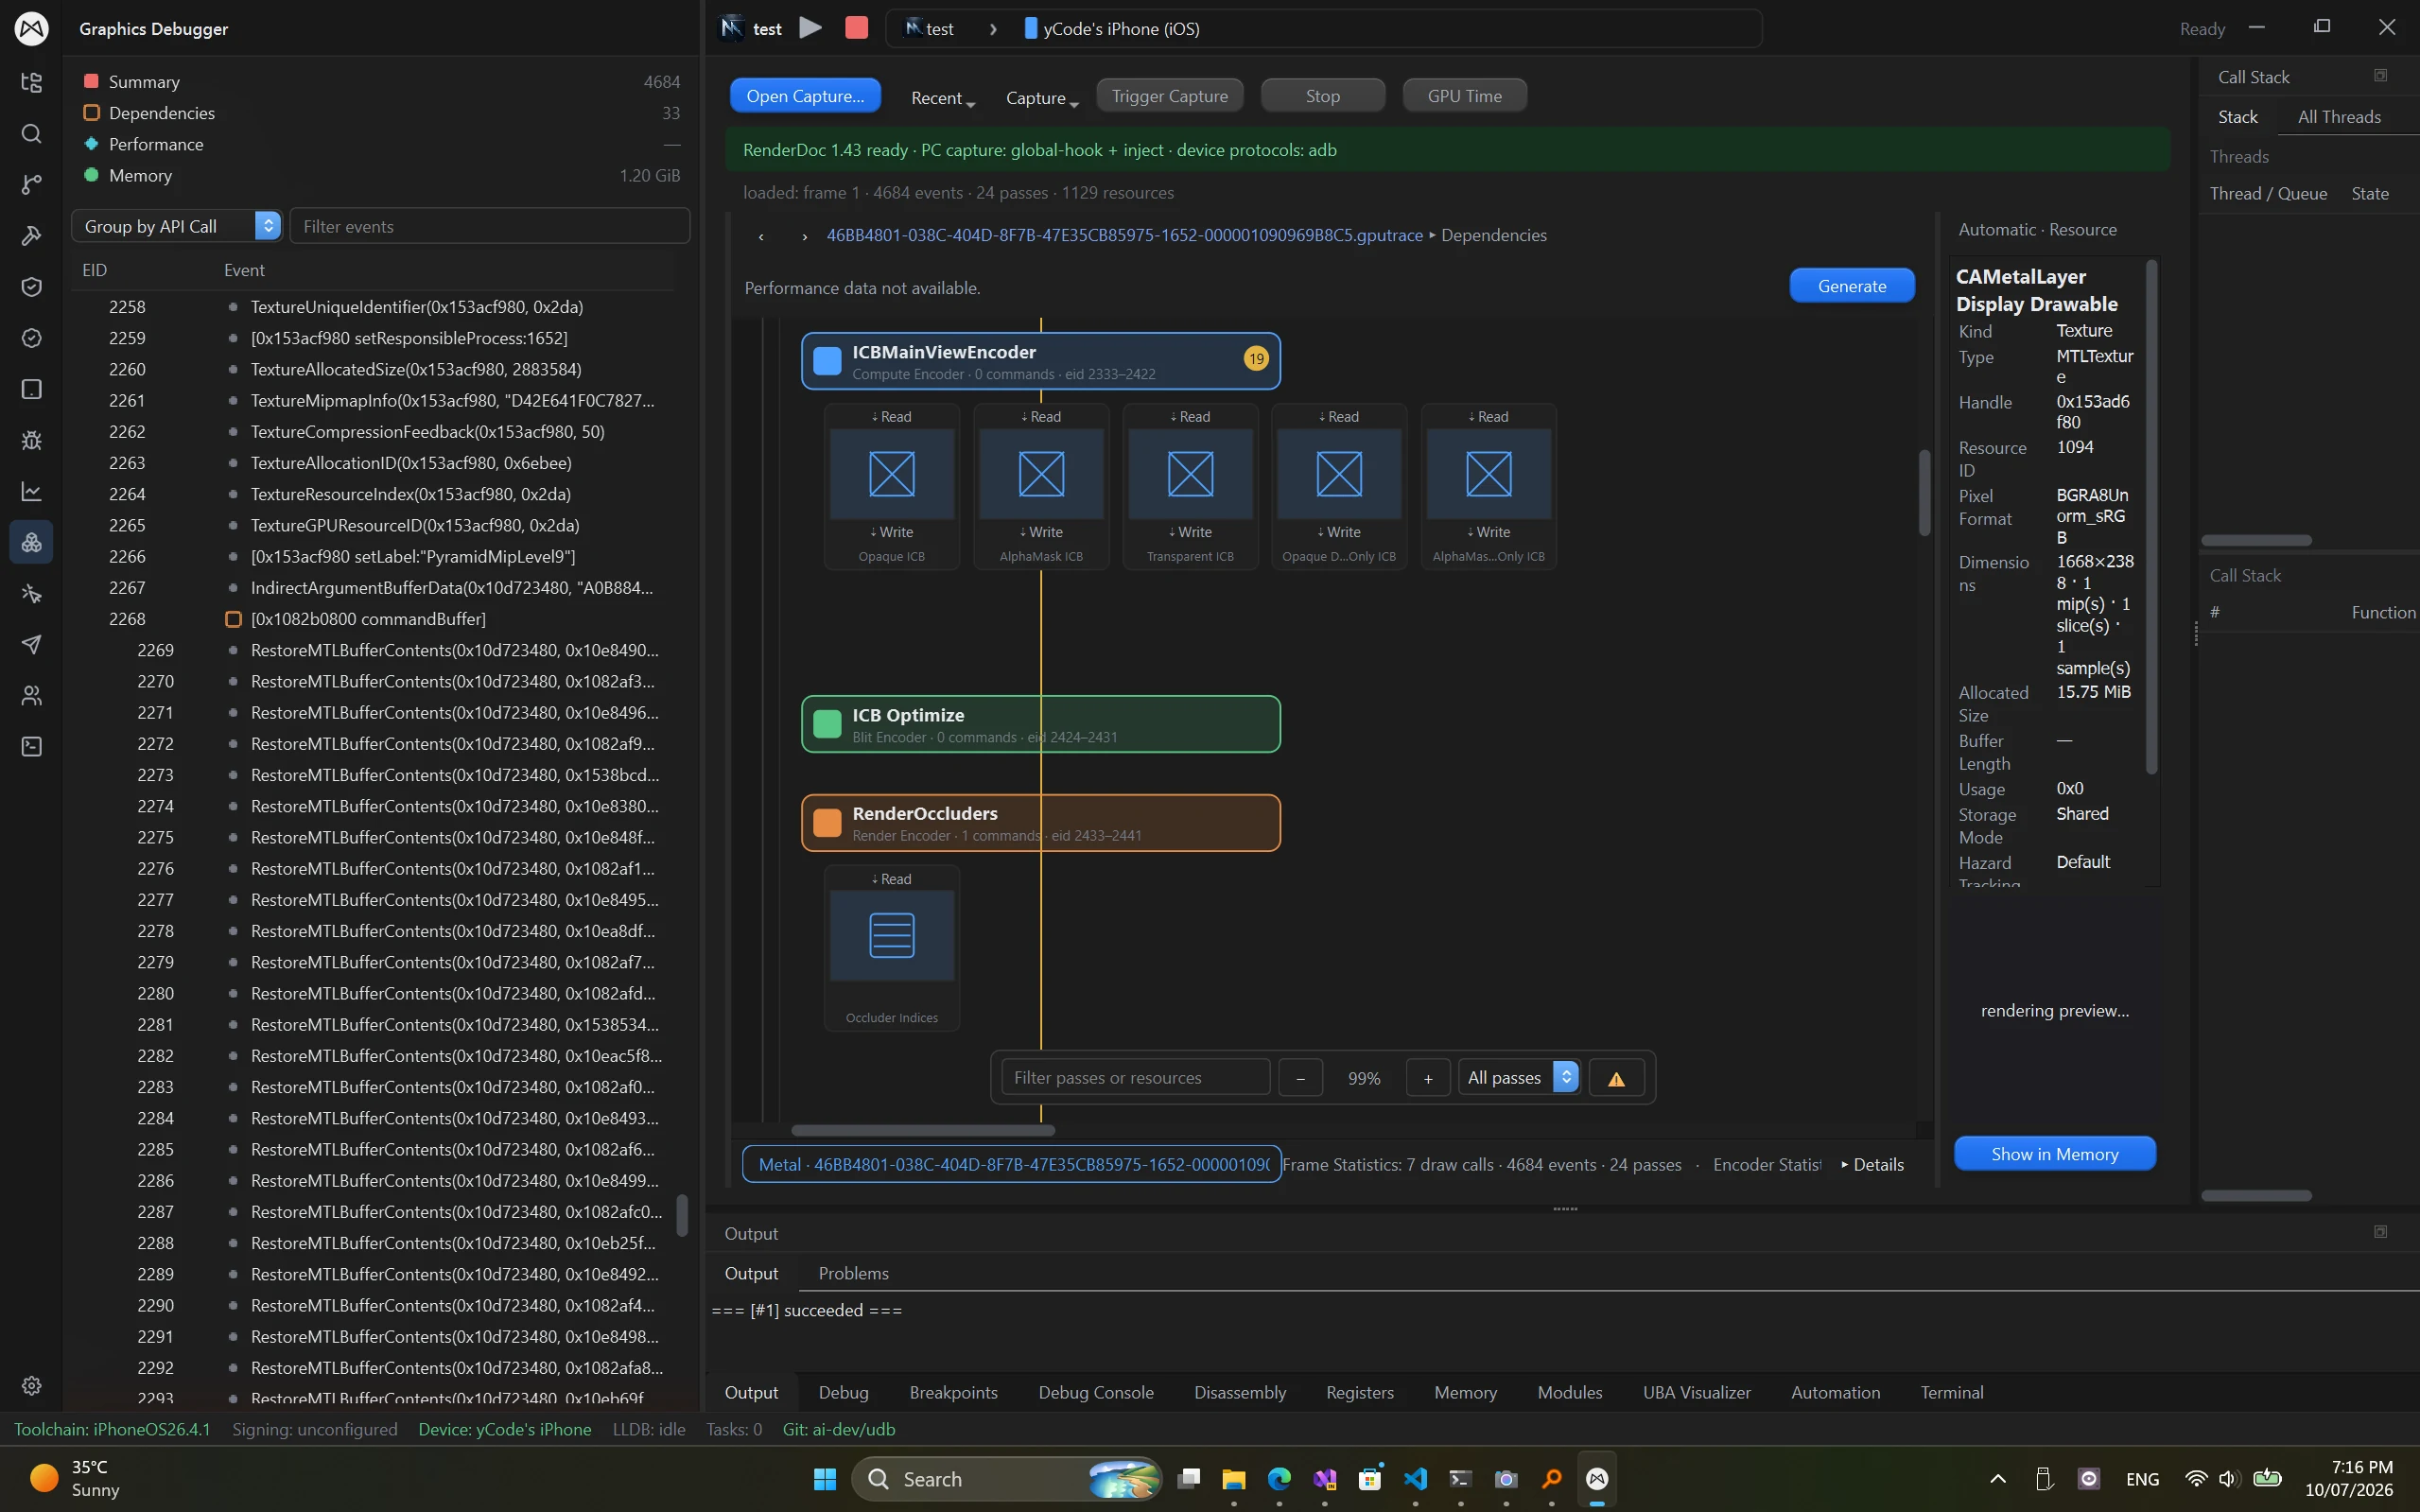
Look beyond the CPU.
When the problem is in the rendered frame, use Ycode's graphics tools to examine Metal captures. Follow passes and resources, and compare the visual evidence with the native execution state.
- Metal frame capture and resource inspection
- Pass dependencies and AI-assisted graphics analysis
- Live device screens and logs for reproduction
Real projects. Recorded workflows.
Different targets. A familiar workspace.
Debug iOS, Android and Windows apps simultaneously from one Windows workspace.
Platforms & devices
Game engines
Native code
Graphics & captures
LSP highlighting & completion
Write application code, scripts and shaders in one editor, with language-server-backed highlighting and completion for these additional languages.
- Rust
- C#
- Java
- Kotlin
- Python
- MetalSL
- Unreal Shader
- Unity ShaderLab
Language support describes editing features. Build, run and debugging support depend on the project's toolchain and target.
Windows is both the desktop host and a debugging target; iOS and Android are connected device targets. Ycode supports simultaneous debugging across all three. Setup and available features depend on the project, toolchain and target version. Download buttons list only published installers.
A few things to know.
Practical answers before you get started.
Can I debug an iOS app from Windows with Ycode?
Yes. Ycode supports simultaneous debugging of iOS, Android and Windows apps from Windows. This guide covers the LLDB-backed native iOS and Unity IL2CPP workflow, which needs a debuggable app, a configured device connection and matching symbols.
Does the Ycode iOS workflow require a Mac?
Ycode includes a Windows-side iOS build, signing, deployment and debugging workflow. You still need the supported Apple SDK and toolchain, appropriate signing credentials and a development-ready device. Compatibility depends on the project, toolchain and iOS version.
Is Unity IL2CPP debugging the same as managed C# debugging?
No. IL2CPP converts managed code into native C++. The demonstrated workflow inspects native execution with LLDB and matching symbols. Source-level visibility depends on the build settings and generated debug information.
Bring your tools into one workspace.
Create a Mix Studio account or sign in to download Ycode. Compare plans for feature access and device or build-node limits.
Join Discord