From a code change to a clearer picture.
Open a project, build it and run it on your chosen target. Debug iOS, Android and Windows apps simultaneously from Windows, then use runtime evidence to guide the next edit. Ycode keeps these stages and your AI tools in one native workspace.
- Project-aware AI agents
- Build and device tools together
- Simultaneous iOS, Android & Windows debugging
A shorter path to your next iteration.
Connect the project
Open your workspace and check the detected toolchains and target settings.
Run the iteration
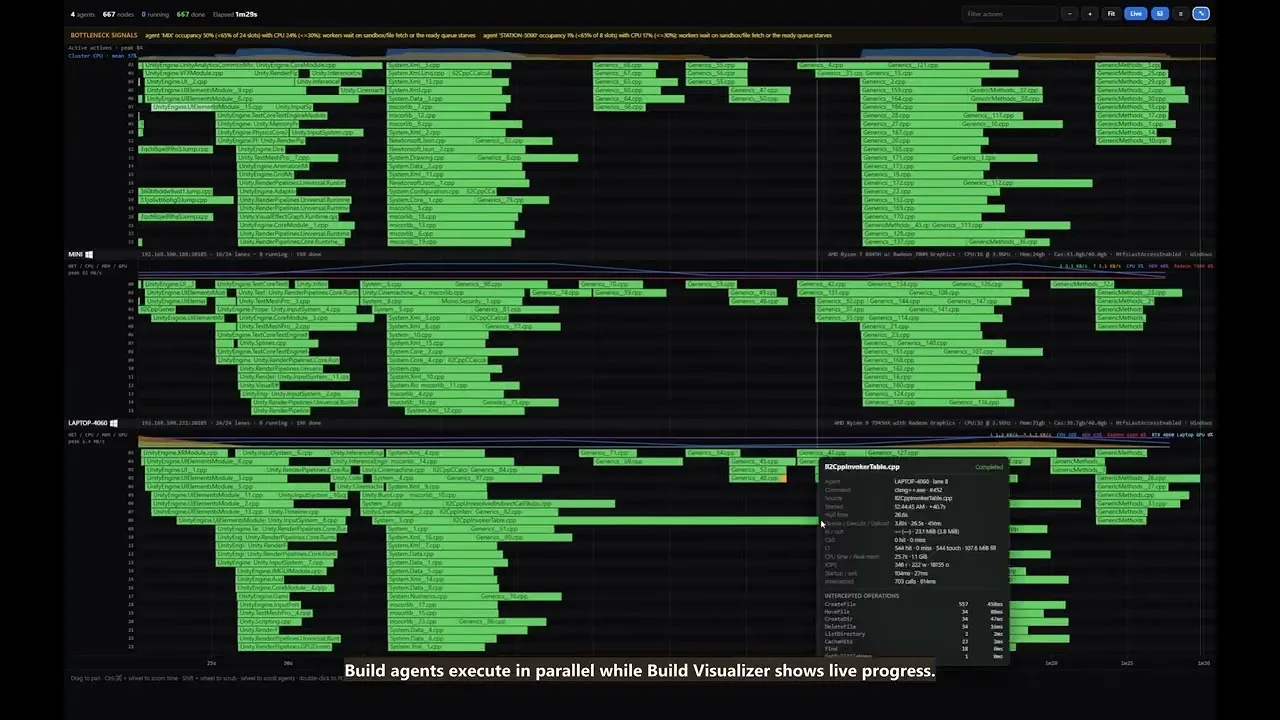
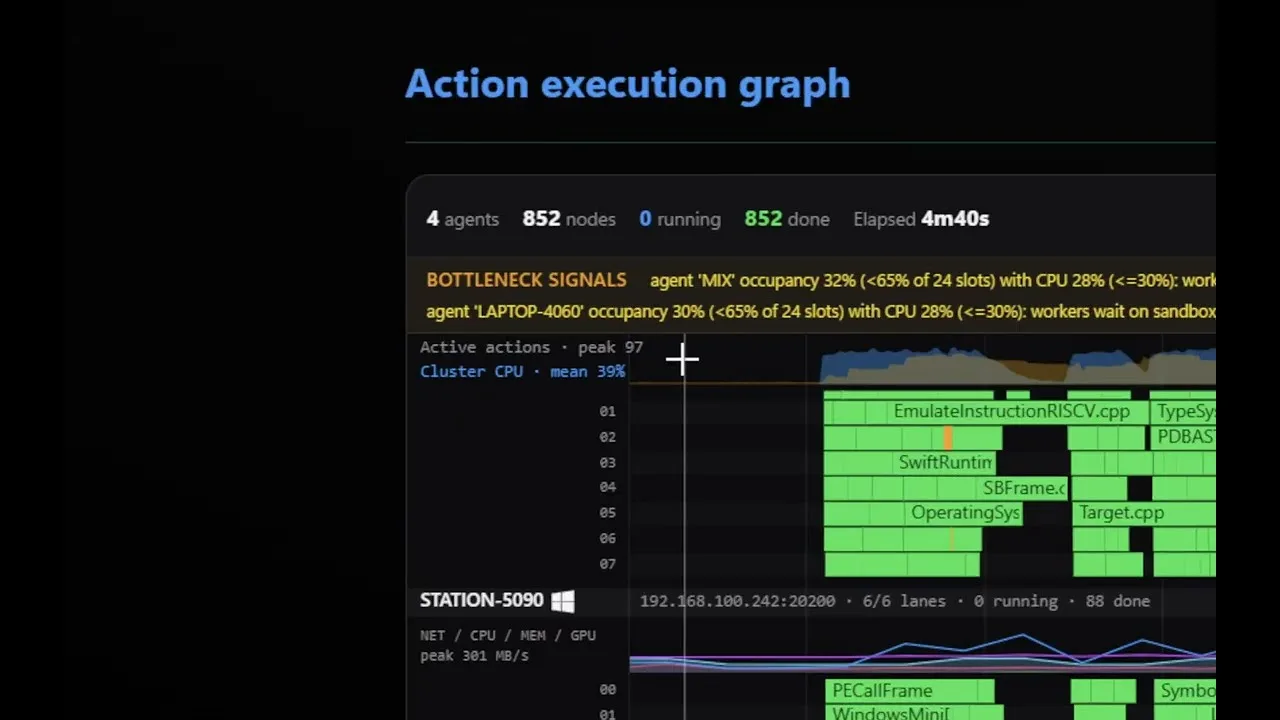
Build locally or across your IrisBuild fleet, then run on an iOS, Android or Windows target.
Follow the evidence
Inspect a stopped frame, device logs or a GPU capture before making the next change.
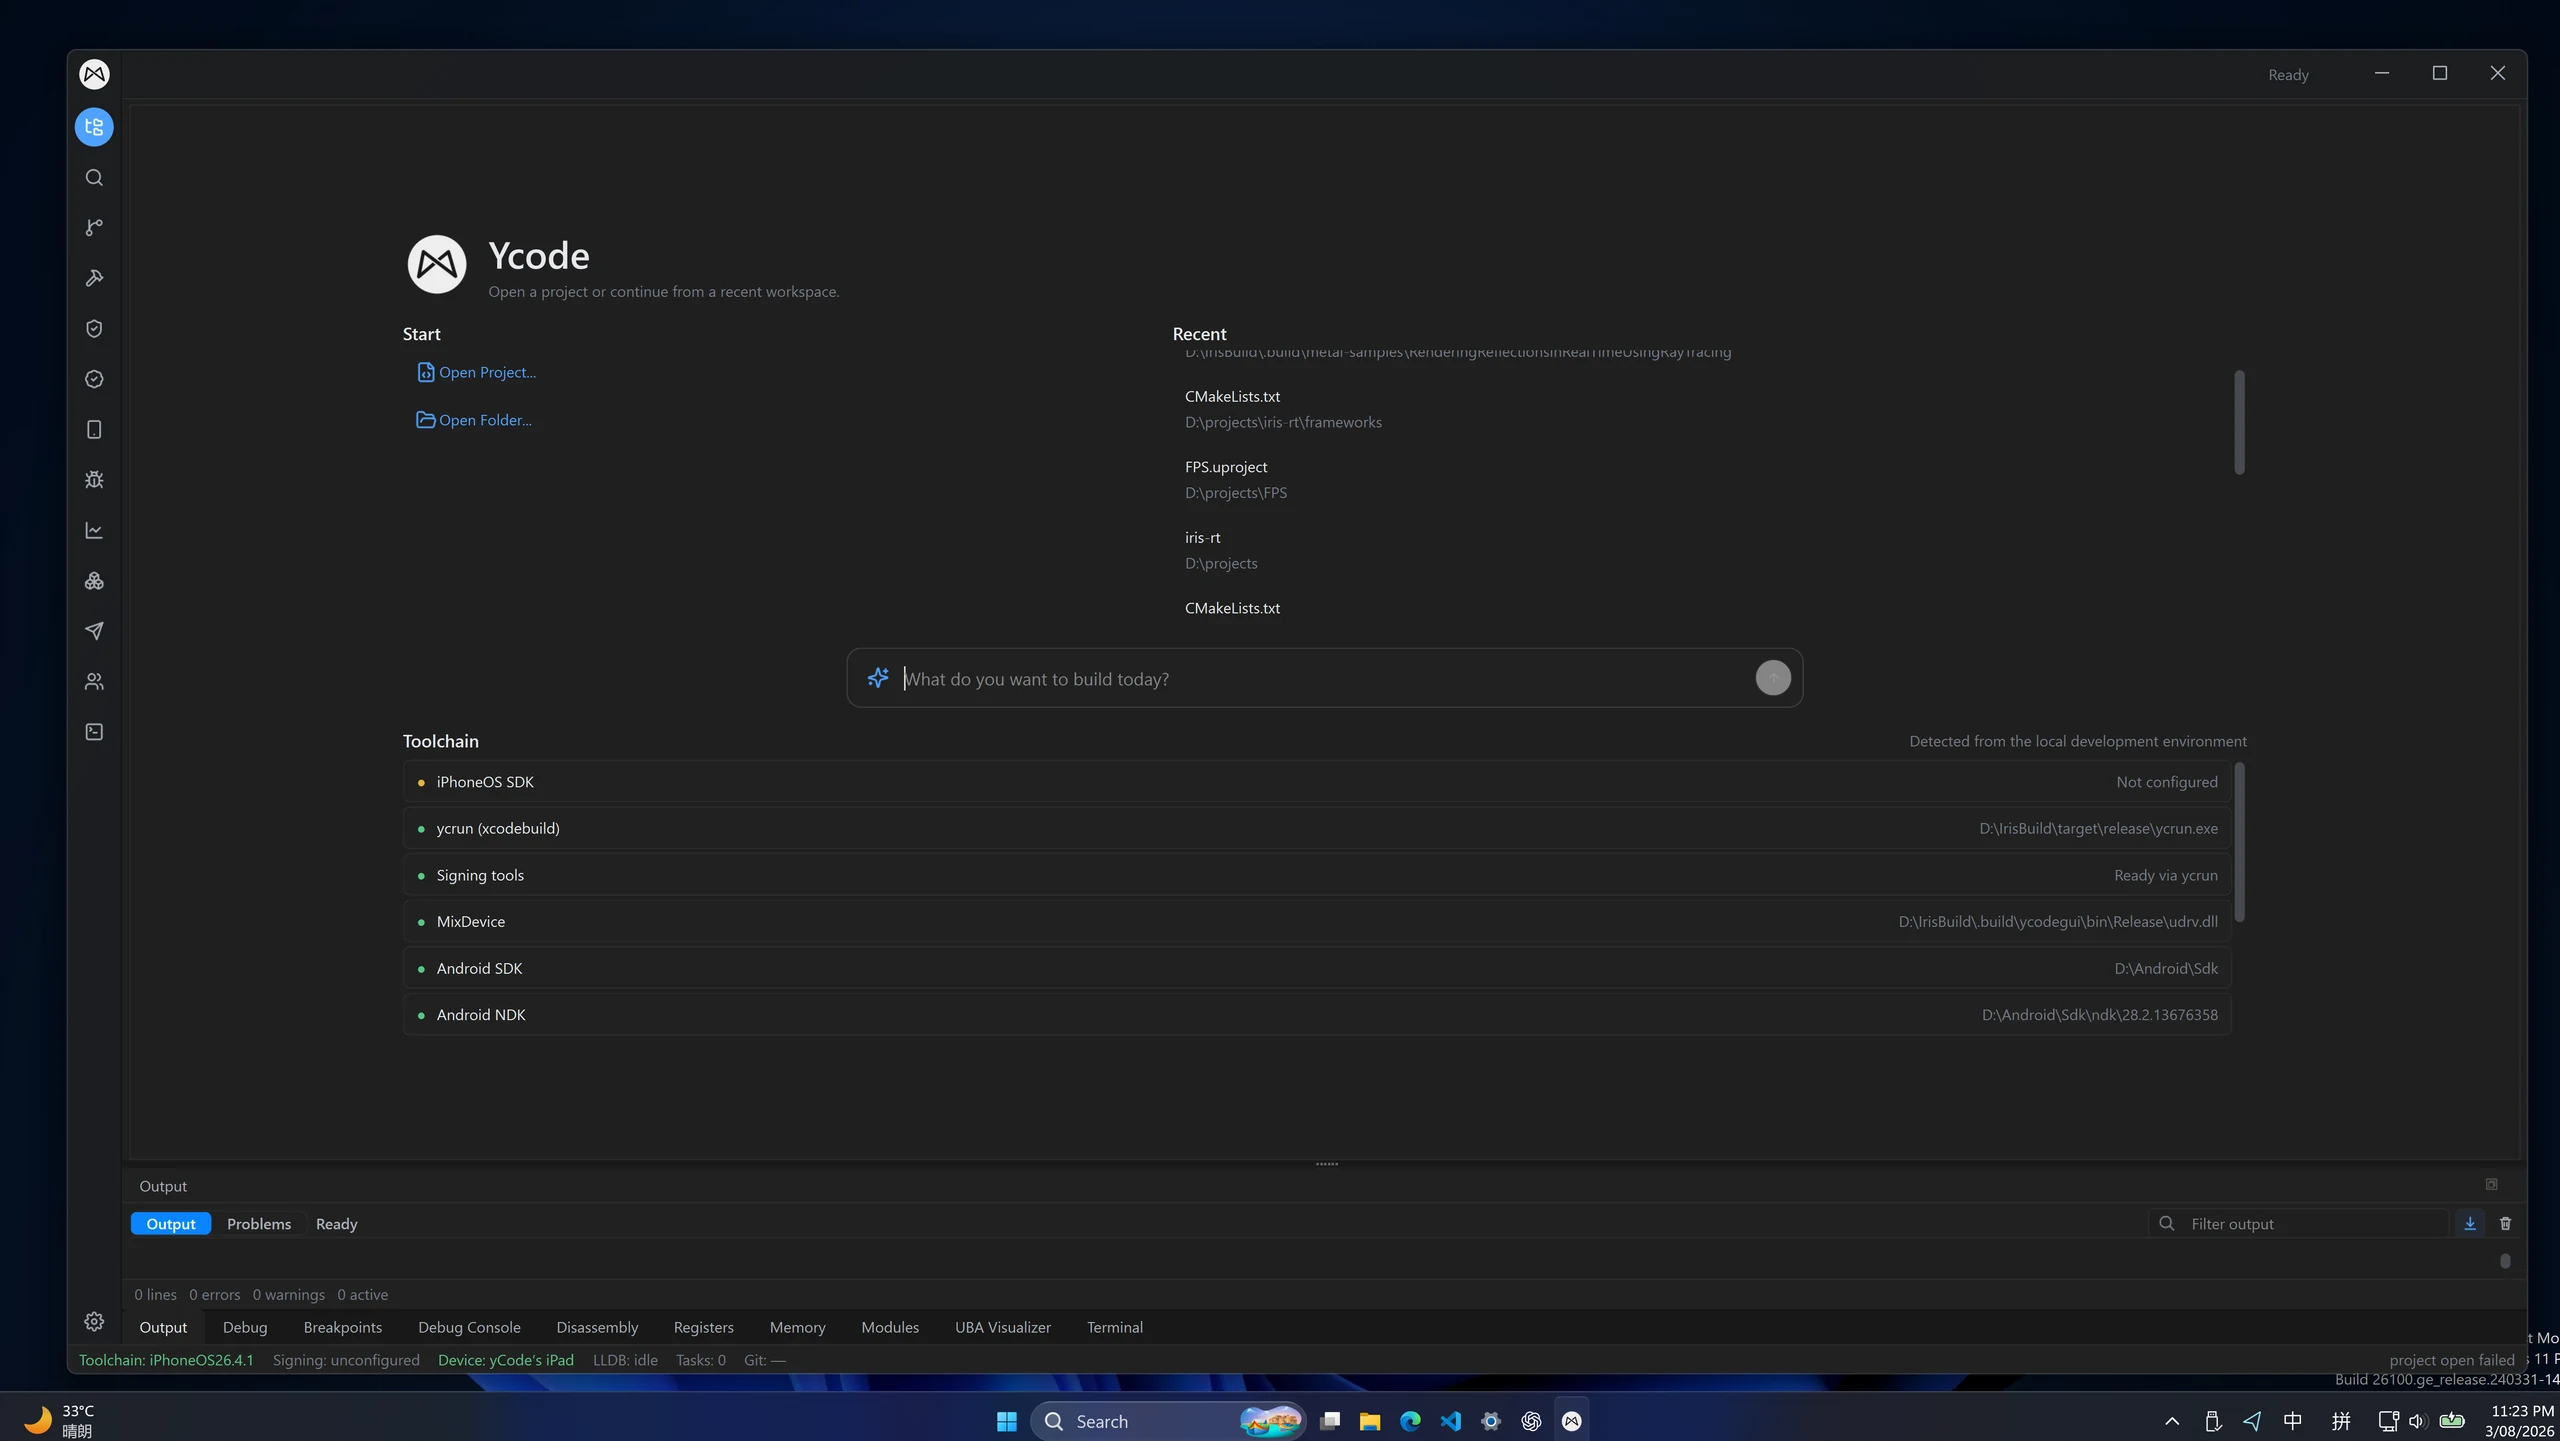
Start with the project you already have.
Open recent projects or choose a workspace. Ycode detects available Apple and Android tooling, while agents and terminals work with the same project context. Use multilingual LSP highlighting and completion while Unreal and Unity integrations keep engine context close.
- Project and folder navigation from the welcome screen
- Apple SDK and Android SDK / NDK discovery
- Agent runs with visible output and isolated worktrees
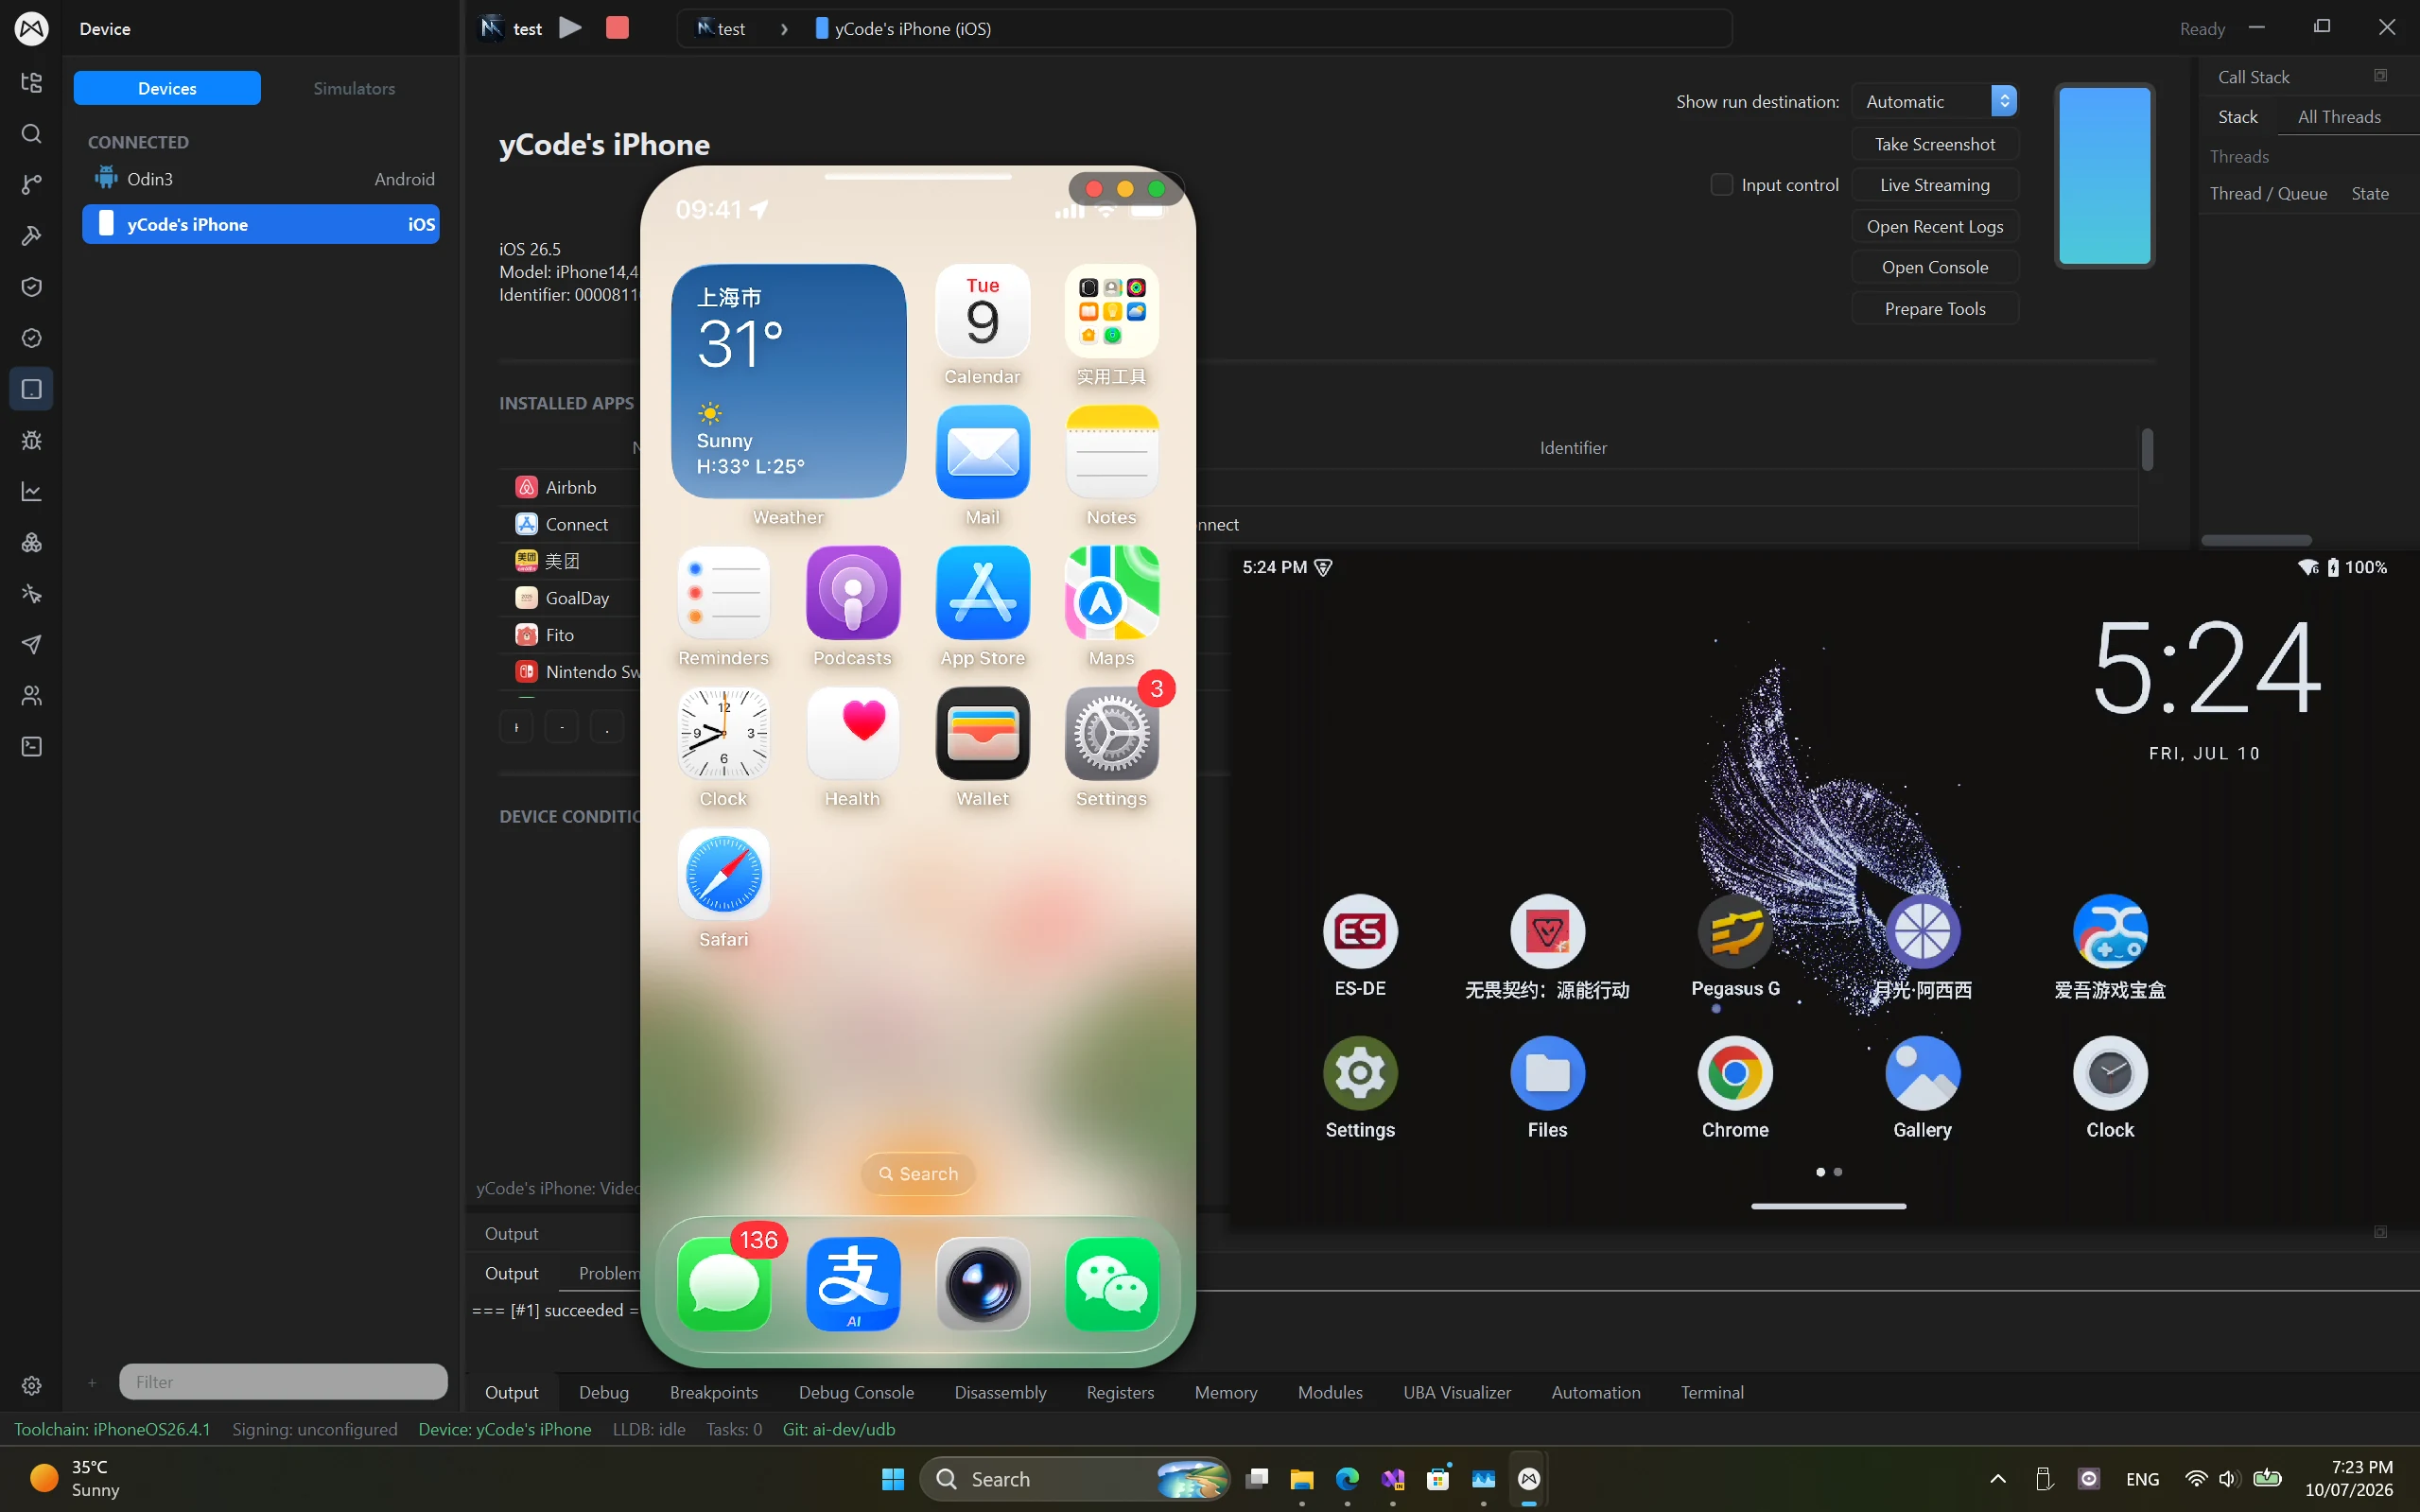
Take the build to its target.
Compile the selected target and run the application on Windows or a connected iOS or Android device. For mobile targets, keep screen streaming, input control and logs beside your source as you reproduce the behavior.
- IrisBuild fleet visibility for distributed compile tasks
- iOS and Android discovery, install and launch actions
- On-device interaction without leaving the workspace
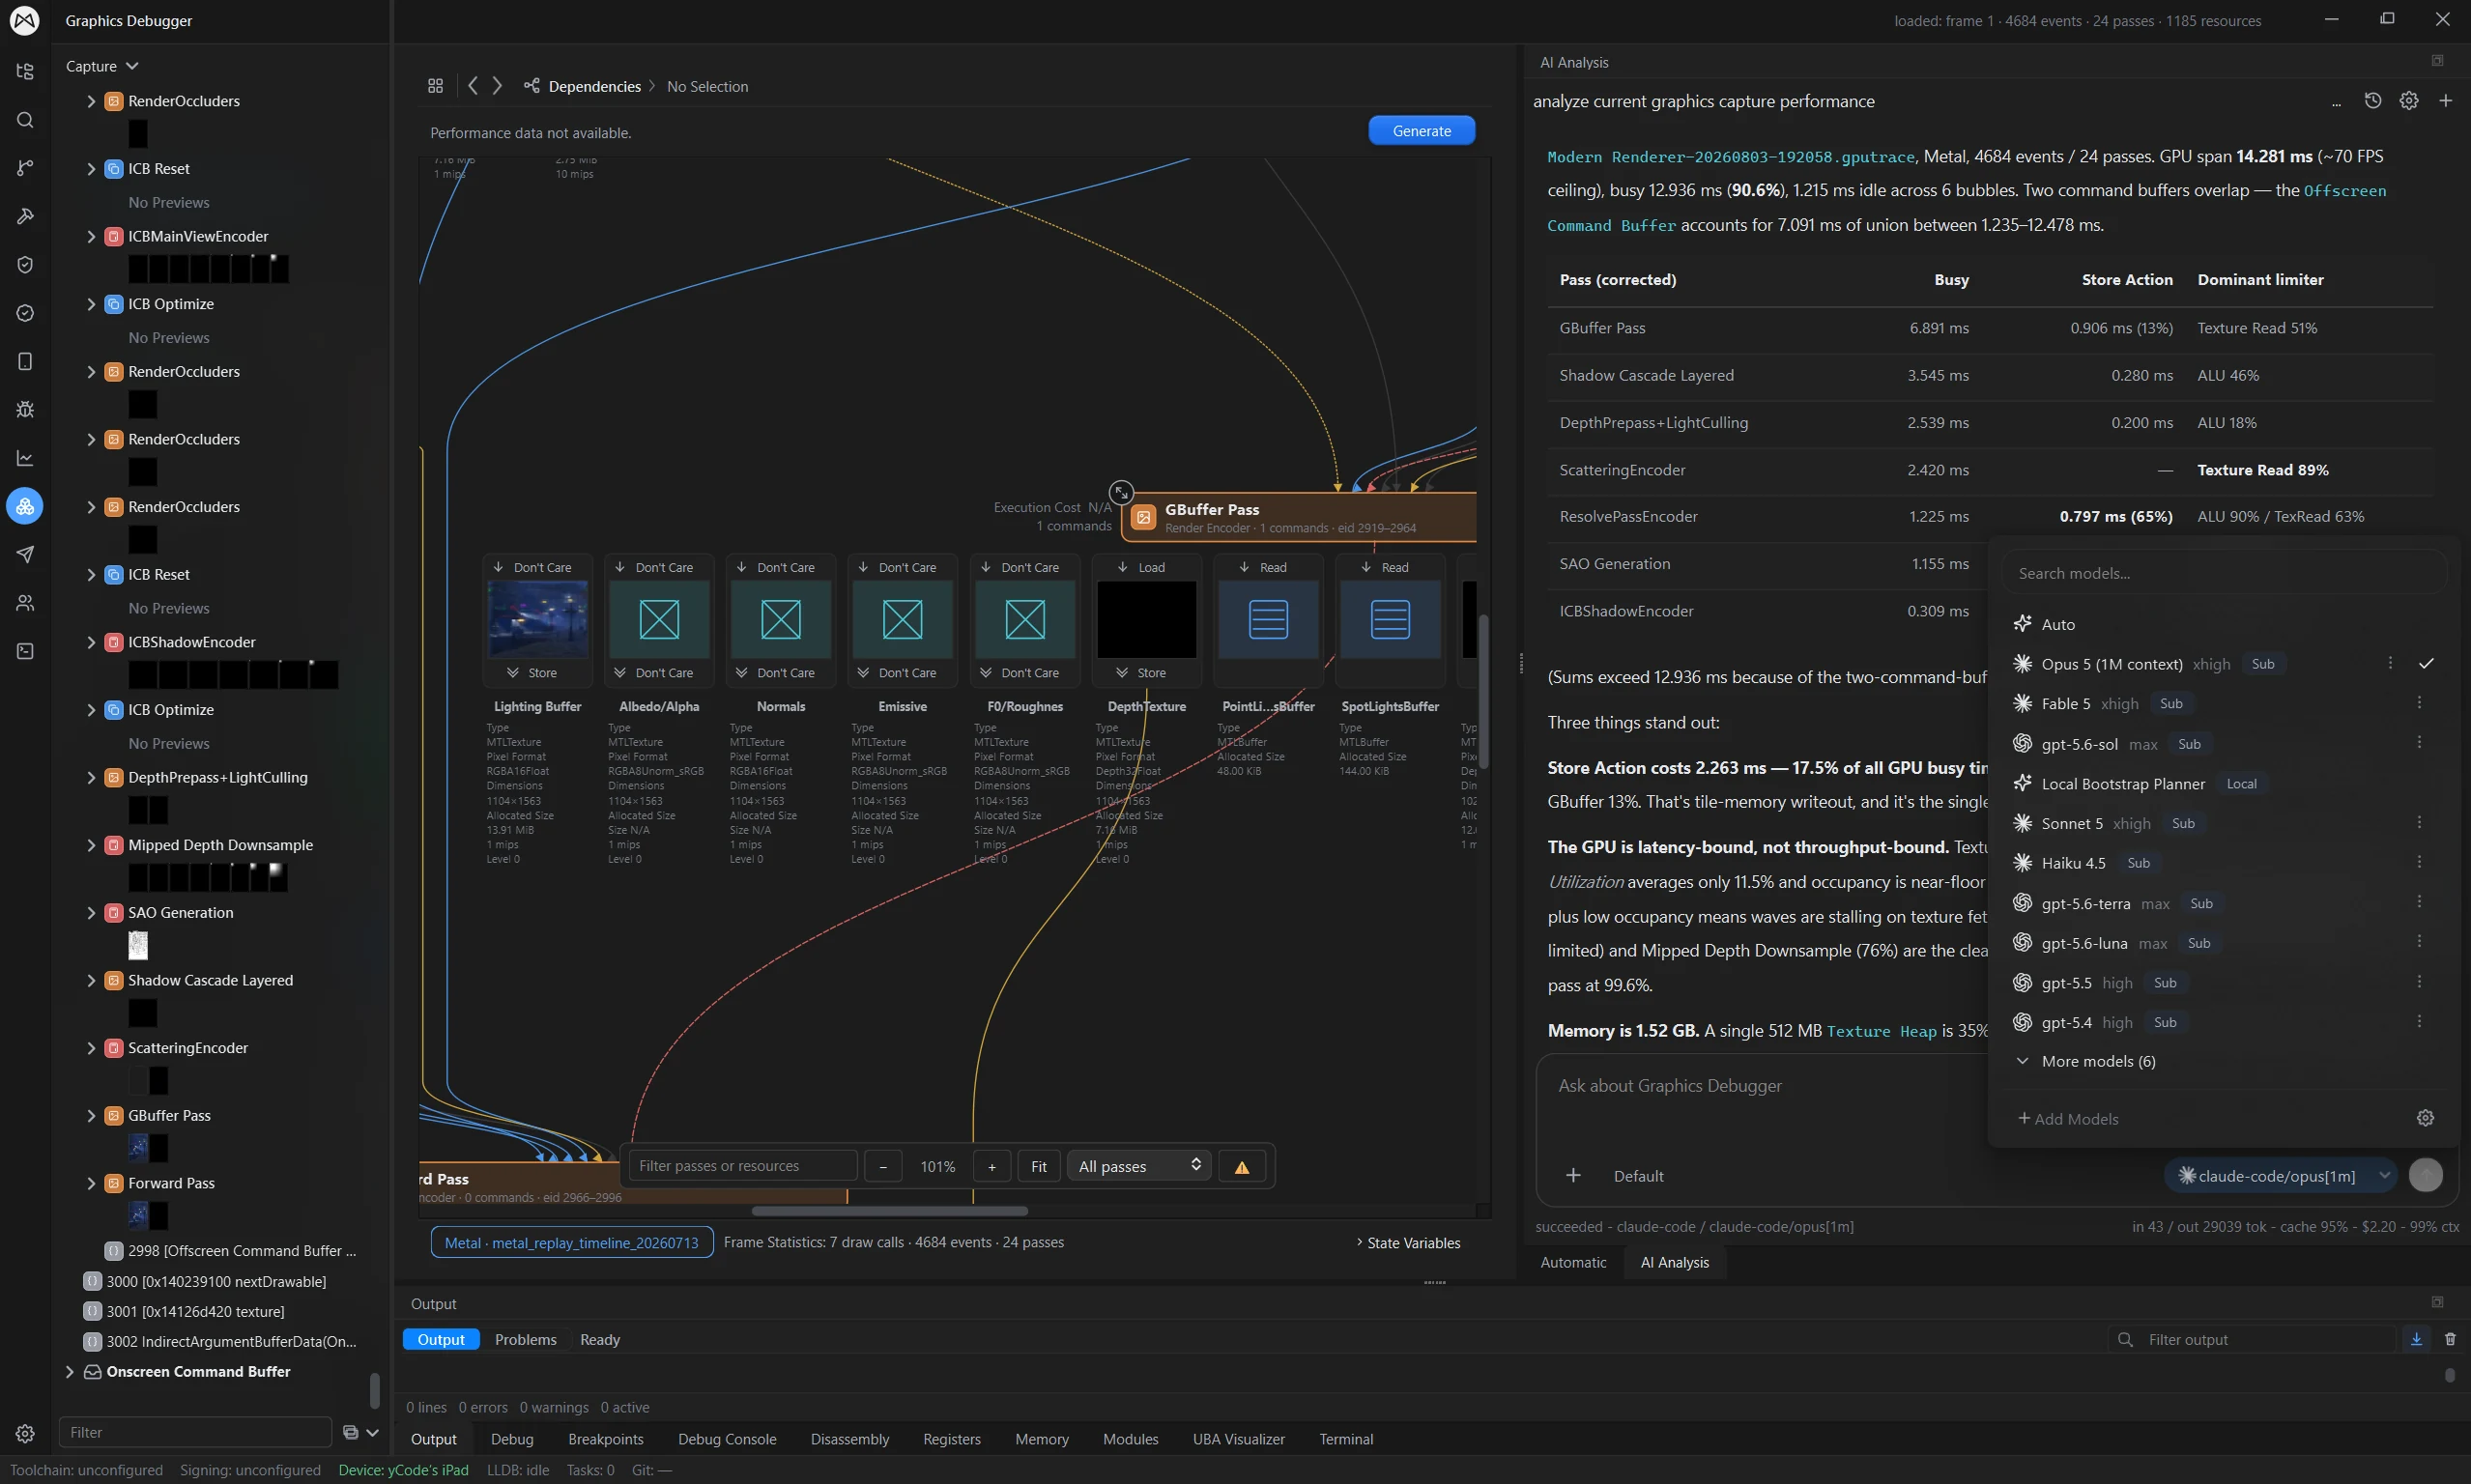
Turn runtime data into the next change.
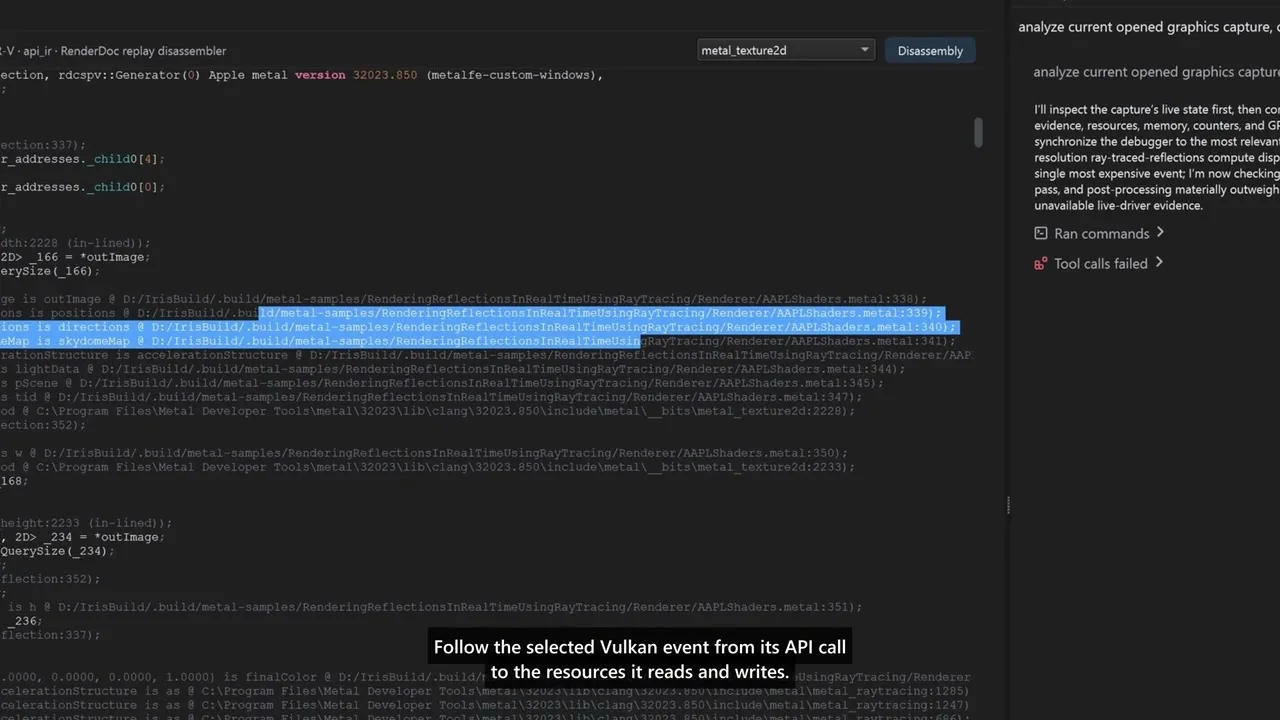
Debug iOS, Android and Windows apps simultaneously from Windows, or open Metal and Vulkan captures to inspect rendering. AI analysis can help explain capture data; validate its suggestions against the captured frame and your project.
- Breakpoints, threads, locals and watches
- Frame, pass and resource dependency inspection
- AI graphics analysis and runtime trace inspection
Real projects. Recorded workflows.
Different targets. A familiar workspace.
Debug iOS, Android and Windows apps simultaneously from one Windows workspace.
Platforms & devices
Game engines
Native code
Graphics & captures
LSP highlighting & completion
Write application code, scripts and shaders in one editor, with language-server-backed highlighting and completion for these additional languages.
- Rust
- C#
- Java
- Kotlin
- Python
- MetalSL
- Unreal Shader
- Unity ShaderLab
Language support describes editing features. Build, run and debugging support depend on the project's toolchain and target.
Windows is both the desktop host and a debugging target; iOS and Android are connected device targets. Ycode supports simultaneous debugging across all three. Setup and available features depend on the project, toolchain and target version. Download buttons list only published installers.
A few things to know.
Practical answers before you get started.
What does a typical Ycode workflow look like?
Open a project, confirm its toolchain, compile locally or with IrisBuild, and run it on an iOS, Android or Windows target. Ycode supports simultaneous debugging across all three from Windows. Use the debugger, logs and graphics captures to guide the next change.
Do AI agents replace the debugger or build tools?
No. Agents work alongside the native tools. Build output, runtime state and capture data provide evidence that you can inspect and use to check proposed changes.
Can I use local builds before setting up a fleet?
Yes. A distributed fleet is a separate part of the workflow. Start with the toolchain and local target for your project, then connect IrisBuild workers when you are ready to distribute eligible tasks.
Bring your tools into one workspace.
Create a Mix Studio account or sign in to download Ycode. Compare plans for feature access and device or build-node limits.
Join Discord